
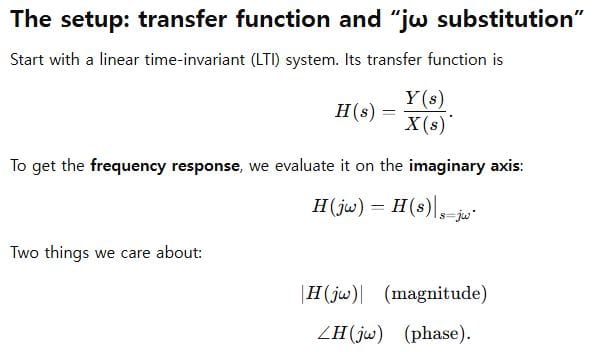
Why you should care about frequency response
When someone says, “What does your system do at high frequency?” they’re really asking about frequency response. And the most compact, engineer-friendly way to see that response is the Bode plot: two stacked graphs, magnitude vs. frequency (in dB) and phase vs. frequency (in degrees), both on a log frequency axis. With just a few straight-line rules, you can sketch it by hand, check stability margins, and understand how poles and zeros sculpt your system.
This post gives you a practical, conversational walk-through. We’ll cover the essentials, the fast sketching rules, and then solve three worked examples (beginner → intermediate → advanced)
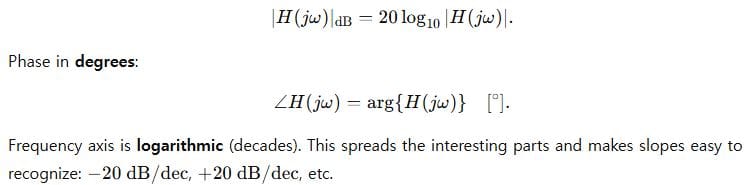
Why decibels and logs?
Because multiplicative gains become additive on a log scale, which makes hand-sketching almost trivial.
Magnitude in decibels:
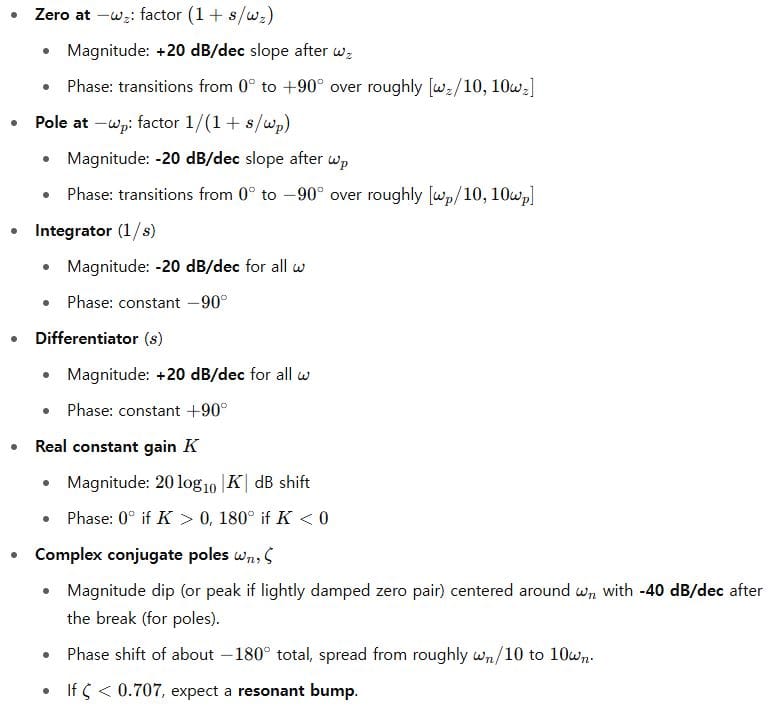
The pole–zero cheat sheet
For a simple first-order factor:
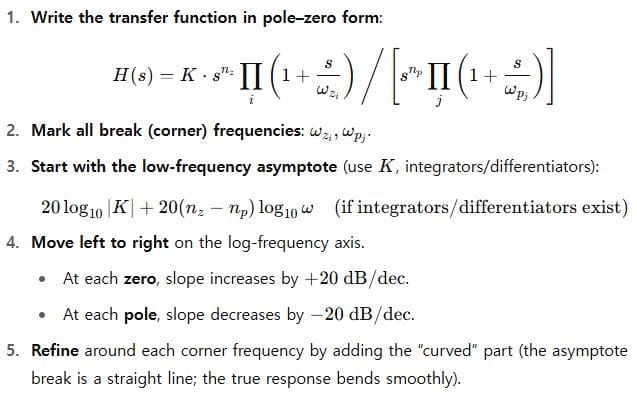
How to sketch a Bode magnitude plot fast
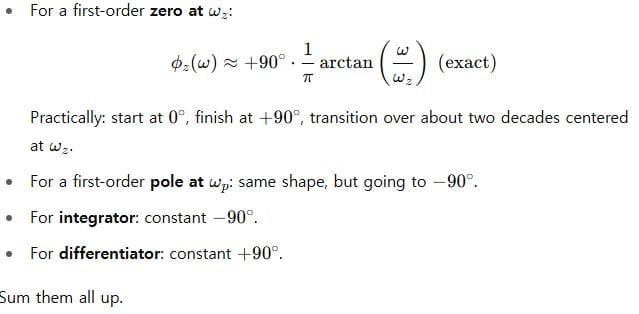
How to sketch the phase plot fast
Add the individual phase contributions:
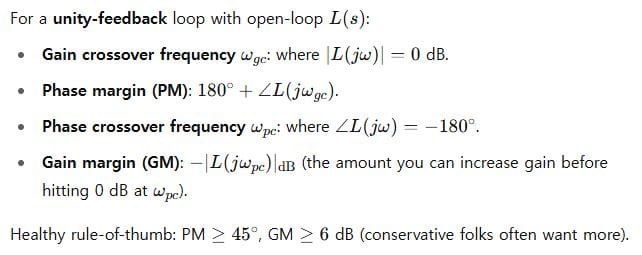
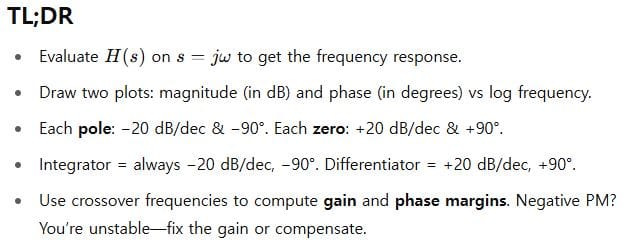
Stability metrics you can read off a Bode plot
Three worked examples (beginner → advanced)
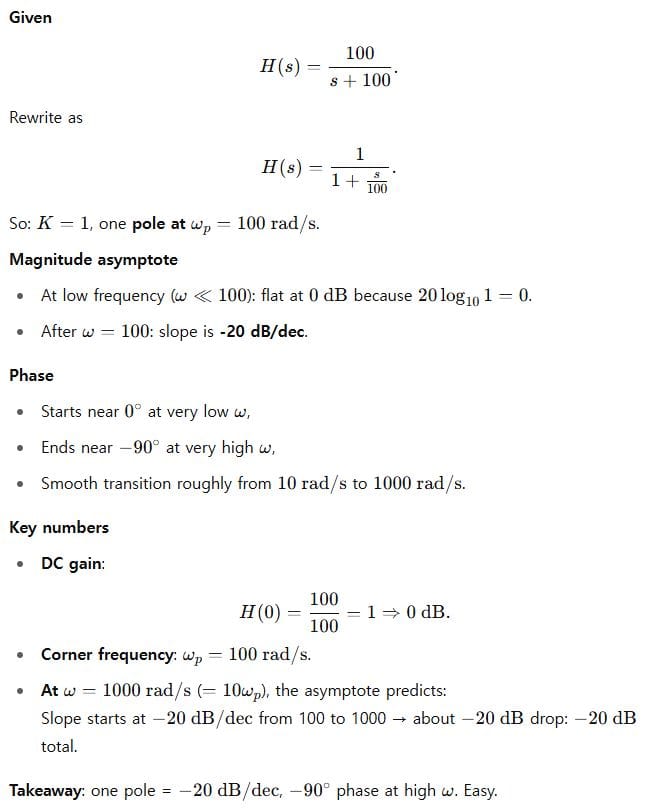
1) Beginner: Single real pole low-pass
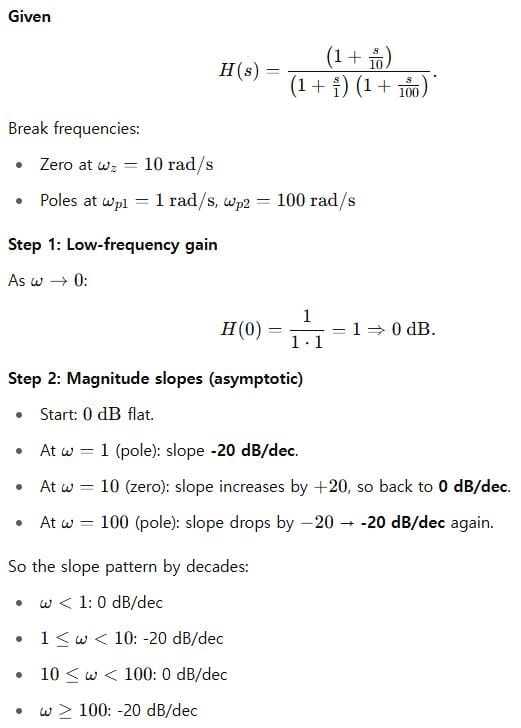
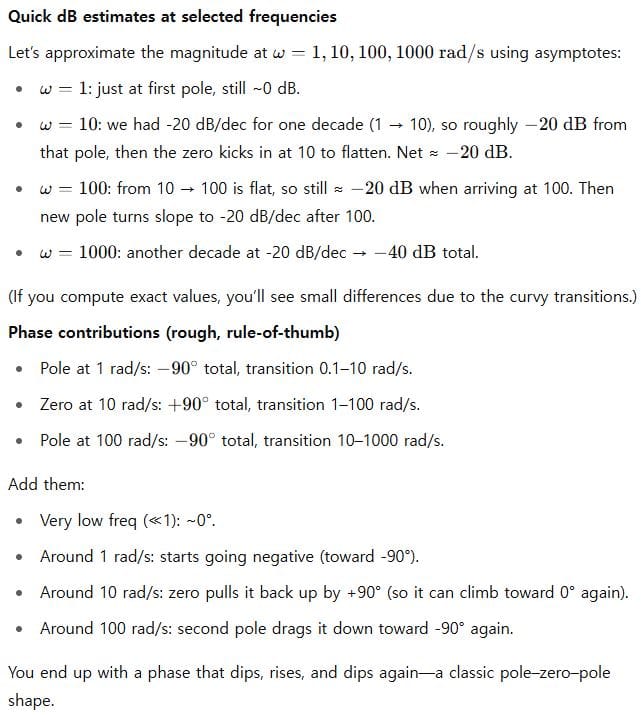
2) Intermediate: A mix of one zero and two poles
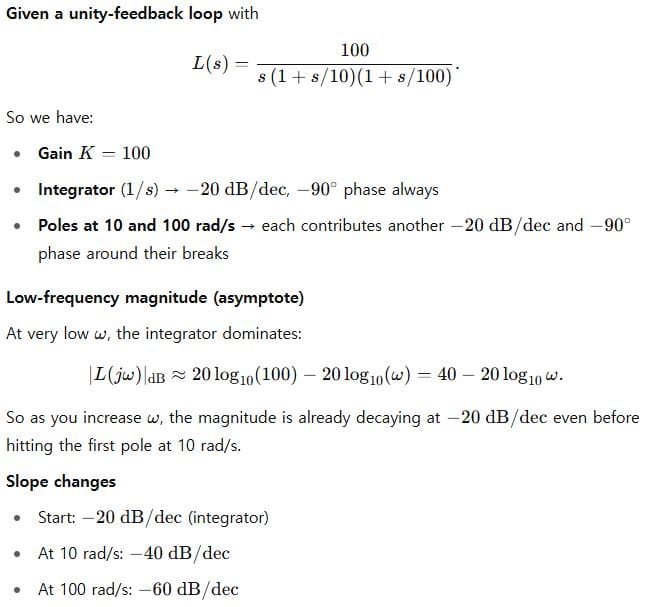
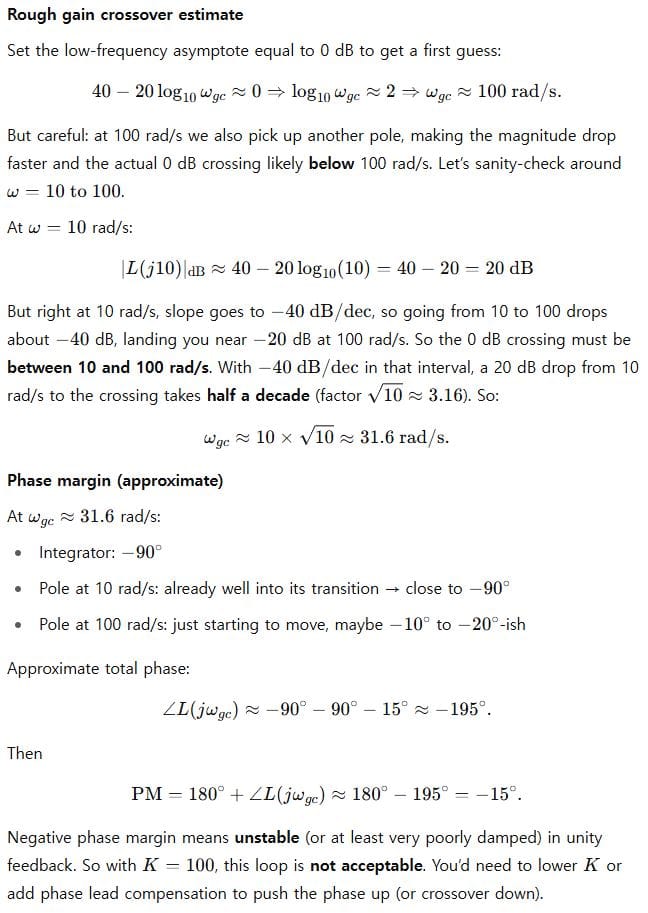
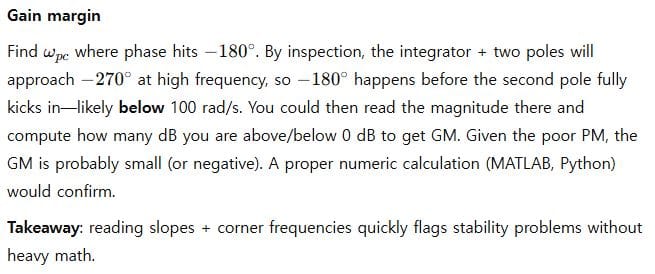
3) Advanced: Open-loop Bode, gain/phase margins
Practical checklist when you draw or read a Bode plot
- Normalize to pole–zero form so you can see gains and break frequencies plainly.
- Mark all corners on the log axis.
- Track the slope: every pole (−20 dB/dec), every zero (+20 dB/dec).
- Sum phases with the “one decade before to one decade after” heuristic.
- For control loops, read PM and GM at the right crossover points.
- Be conservative: margins tighter than ~45° PM or 6 dB GM are asking for trouble in real hardware.
Leave a Reply